


In his Druid Summit 2024 keynote, Eric Tschetter emphasized Druid’s potential for behavioral analytics. This article builds on Eric’s keynote, offering insights and strategies for designing analytics that prioritise behaviour.
Apache Druid is an established OLAP database very often used to consume events from an event stream. It can connect to these streams natively, providing exactly once guarantees, and it scales flexibly to meet requirements for throughput and long-term storage. In addition to stream ingestion, Druid can batch ingest from technologies like S3, and it has multiple massively parallelized query engines to analyze behavior using SQL.
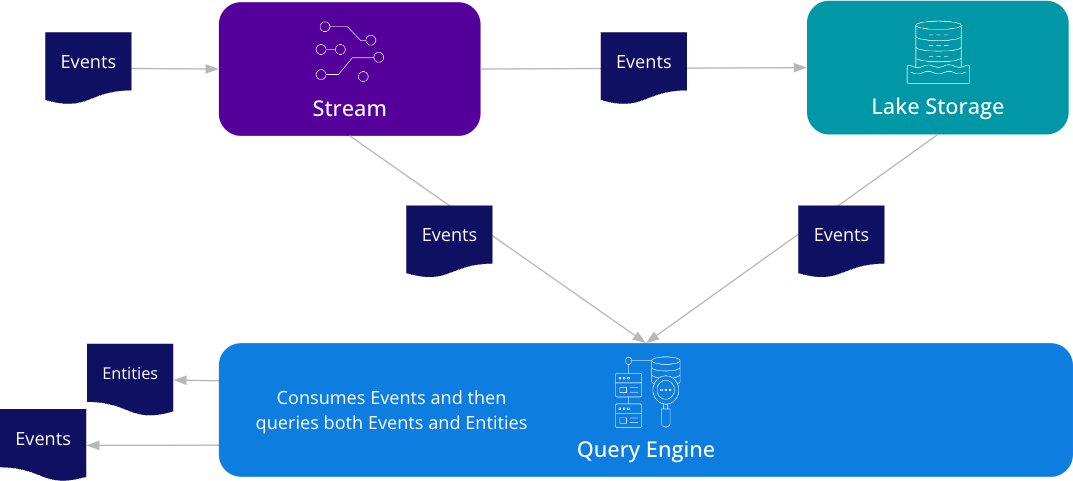
From Eric’s talk, showing Apache Druid consuming event data from streams, combining it with data from storage, and converting them into entities and events in real time.
In his talk, Eric argues that the infrastructure-driven distinction between OLAP and OLTP “has run its course”. The continuing decomposition of databases into independent services (write-ahead log became pub/sub and streams like Kafka, and internal storage became lake storage) leads to a point in time when picking between an OLAP or an OLTP database is coming to an end.
It’s time to start focusing on the data, and to ask what people are trying to do with it.
Entities: mutable “objects we interact with … in the real world [that are] constantly changing”.
Events: timestamped and immutable “actions and activities”.
Query engines (including Druid) need to be able to “reconstitute entities just as much as you need it to aggregate events - you need to be able to use that engine to do both … converting events into events and aggregations of events depending on what the system needs”.
“As you're approaching your data problems, think first in terms of what entities you are dealing with, what events are happening around those, and what does your product need to expose?”
Challenge accepted!
Eric’s example: Druid Summit
Eric provides a simple example: attendees coming in and out of the various sessions that took place at Druid Summit.
Let’s apply a formal methodology, the Open Group’s enterprise architecture modeling language, Archimate.
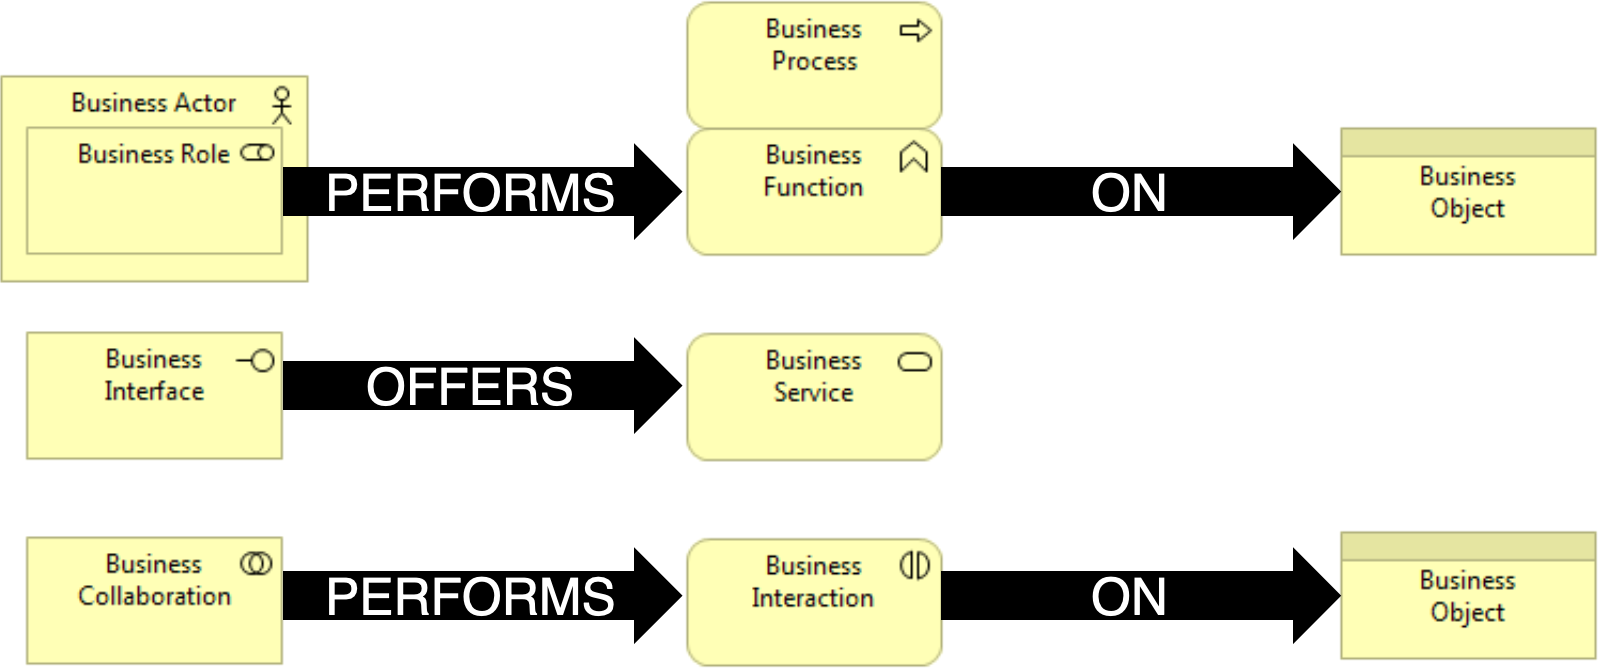
Part of the fundamental elements of Archimate models, used to describe the Business Layer.
“Business Actor” is an active element - this is what performs activity.
“Business Process” is a behavioral element - this is the activity itself.
“Business Object” is a passive element - this is what’s being affected by the activity.
Here is the model applied to Eric’s talk:
The active element is a guest.
The guest is assigned to attend talks.
The passive element is a room.
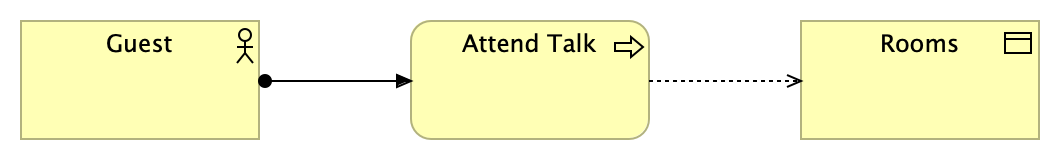
A guest is assigned to attend talks at Druid Summit, accessing a session in a room.
As guests attend talks, they move in and out of rooms, causing room.population to go up and down.
Let’s imagine that, each time a guest attends a talk, there’s some application being used by one of the summit crew that emits an event to the stream.

As attend talks executes, it pushes an event out into the stream.
We might imagine that each event contains data relating to:
The process itself: when it happened and whether it executed successfully.
The subject of the process, namely the room.
The actor, in this case the guest.
guest.location changes as each person moves around the conference. As does guest.feeling_of_awesomeness which, naturally, only went up and up and up for attendees of Druid Summit!
If you’re in AdTech, clickstream, or observability, you’ll relate to this immediately. An action on a website or on the network causes an event to be emitted. And each event gives us:
Entity dimensions: data related to the state of passive and active entities at that point in time.
Event dimensions: data about when and what activity happened.
A real-world example: flight data
Here at Imply, a small team of techie geeks collect automatic dependent surveillance broadcast data from aircraft. Starting simple, the system looks like this:
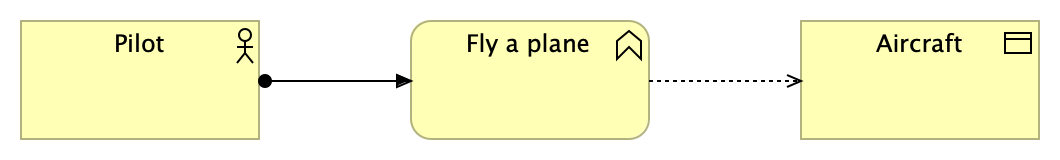
A pilot (actor) is assigned to fly a plane (behavior), which affects an aircraft (entity).
What might we expect to see?
Entity dimensions: Data about aircraft and the pilots.
Event dimensions: Data about flying a plane.
Identify entity dimensions
Let’s start with the aircraft. Each event records geospatial information for a given transmitter on a plane.
hex_ident_validentifies each aircraft.latitude,longitude, and other telemetry give geospatial data.
“When you take events,” asked Eric, “how do you model the entities? How do you bring them back together?” Using the LATEST or LATEST_BY functions, the following query reconstructs the latest state of an aircraft, as identified by its hex_ident_val.
SELECT
  "hex_ident_val",
  LATEST("callsign"),
  LATEST("altitude"),
  LATEST("latitude"),
  LATEST("longitude"),
  LATEST("ground_speed"),
  LATEST("track"),
  LATEST("vertical_rate")
FROM "example-adsb-intro"
WHERE client_id = 'pema-0'
AND "__time" >= CURRENT_TIMESTAMP - INTERVAL '10' MINUTE
GROUP BY 1
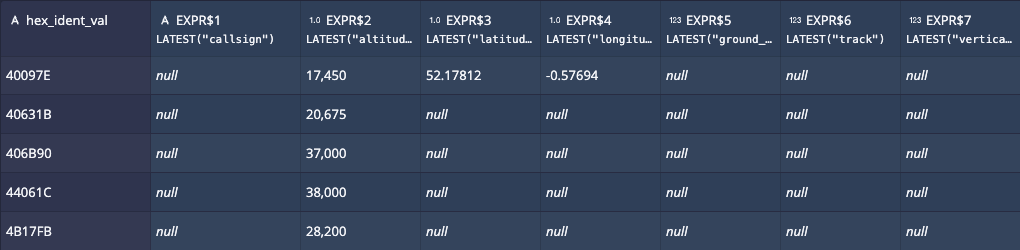
Here, we see 40097E’s current state: altitude, latitude, longitude, and so on. It is calculated by taking a window of time, and finding the latest value.
Aha! But notice that, for 400097E, we face a common problem with event data in the real-world - something that Eric called out in his talk: event streams don’t always contain all the data! Take a look at 406B90: there is hardly any geospatial data.
To understand why this happens, it’s necessary to unpick where the producer of the event data is. And that neatly brings us to step 2: identifying event dimensions.
Identify event dimensions
The data we collect is generated more like a “heartbeat” than as part of the “fly a plane” action. The producer exists in a long-running process, looking at other entities and emitting their state frequently. This pattern is common in video streaming analytics: entity data is generated at regular intervals by an external, asynchronous process, rather than being embedded in the main process.
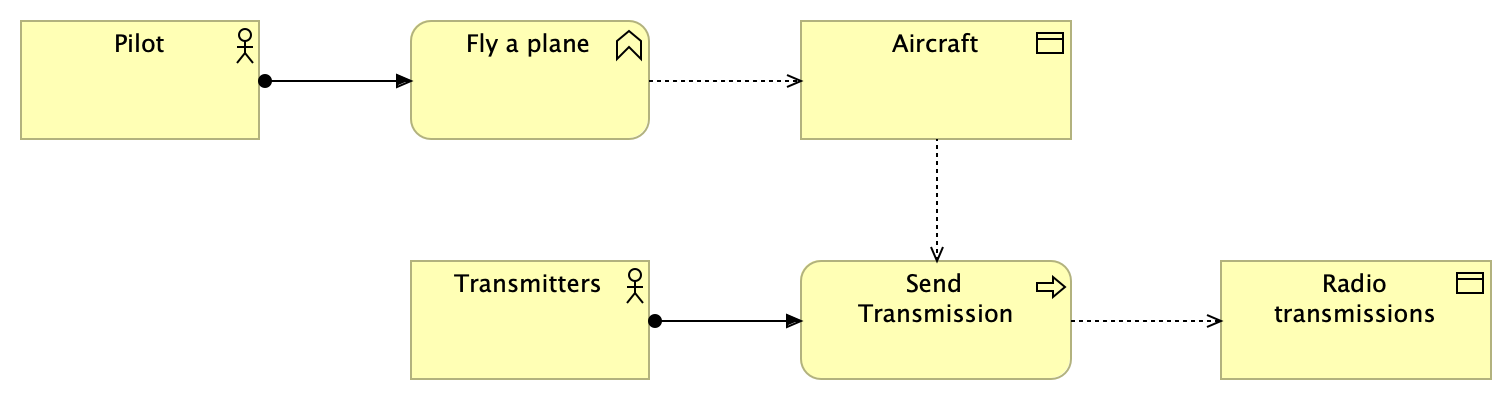
Flying a plane affects the aircraft, but the “Send Transmission” process actually generates events.
We believe (!) that we receive data intermittently from a number of sensors as each transmitter reads and broadcasts it. Mapping this out in this way gives us scope: we know flying a plane is the overall behaviour that drives everything else, but we can’t model that directly because the producer is in a separate system.
The event data that we get, then, is:
ts_generatedts_loggedtransmission_type
The “ts” fields are timestamps. Picking the timestamp to use is, as Druid users will know, an important design consideration - out of scope for this article! (FYI we picked ts_logged…)
transmission_type tells us what aircraft telemetry is being broadcast. Check out the table below: some events for 406B90 have ground speed and track, some have latitude and longitude - all depending on the transmission type.
In Druid, FILTER (WHERE) can be added to an aggregate to ignore particular rows in the calculation. Below, the same aircraft is shown, this time with complete data.
SELECT
  "hex_ident_val",
  LATEST("callsign") FILTER (WHERE "callsign" IS NOT NULL) AS "callsign",
  LATEST("altitude") FILTER (WHERE "altitude" IS NOT NULL) AS "altitude",
  LATEST("latitude") FILTER (WHERE "latitude" IS NOT NULL) AS "latitude",
  LATEST("longitude") FILTER (WHERE "longitude" IS NOT NULL) AS "longitude",
  LATEST("ground_speed") FILTER (WHERE "ground_speed" IS NOT NULL) AS "ground_speed",
  LATEST("track") FILTER (WHERE "track" IS NOT NULL) AS "track",
  LATEST("vertical_rate") FILTER (WHERE "vertical_rate" IS NOT NULL) AS "vertical_rate"
FROM "example-adsb-intro"
WHERE "hex_ident_val" = '406B90'
AND TIME_IN_INTERVAL("__time", '2024-10-30T22:20/PT10M')
GROUP BY 1

TIME_IN_INTERVAL prescribes the period of time to use to reconstitute entity state. Each query must cover a long enough period of time to enable LATEST to reconstitute the state, especially when faced with sparse data sets like this one.
There can be as many as 250 events per minute per aircraft, depending on the equipment on-board. By holding onto the raw data, Druid allows for time-travel! For example, by shifting the interval in the TIME_IN_INTERVAL function to PT1H/2024-10-30T20:00 Druid can reconstitute the state of the aircraft at 8pm using an hour's worth of past events.
Combine both approaches: LATEST and historical state data - and it’s possible to create dashboards that allow a user to see, compare, and have fun with (!) entity state over time.
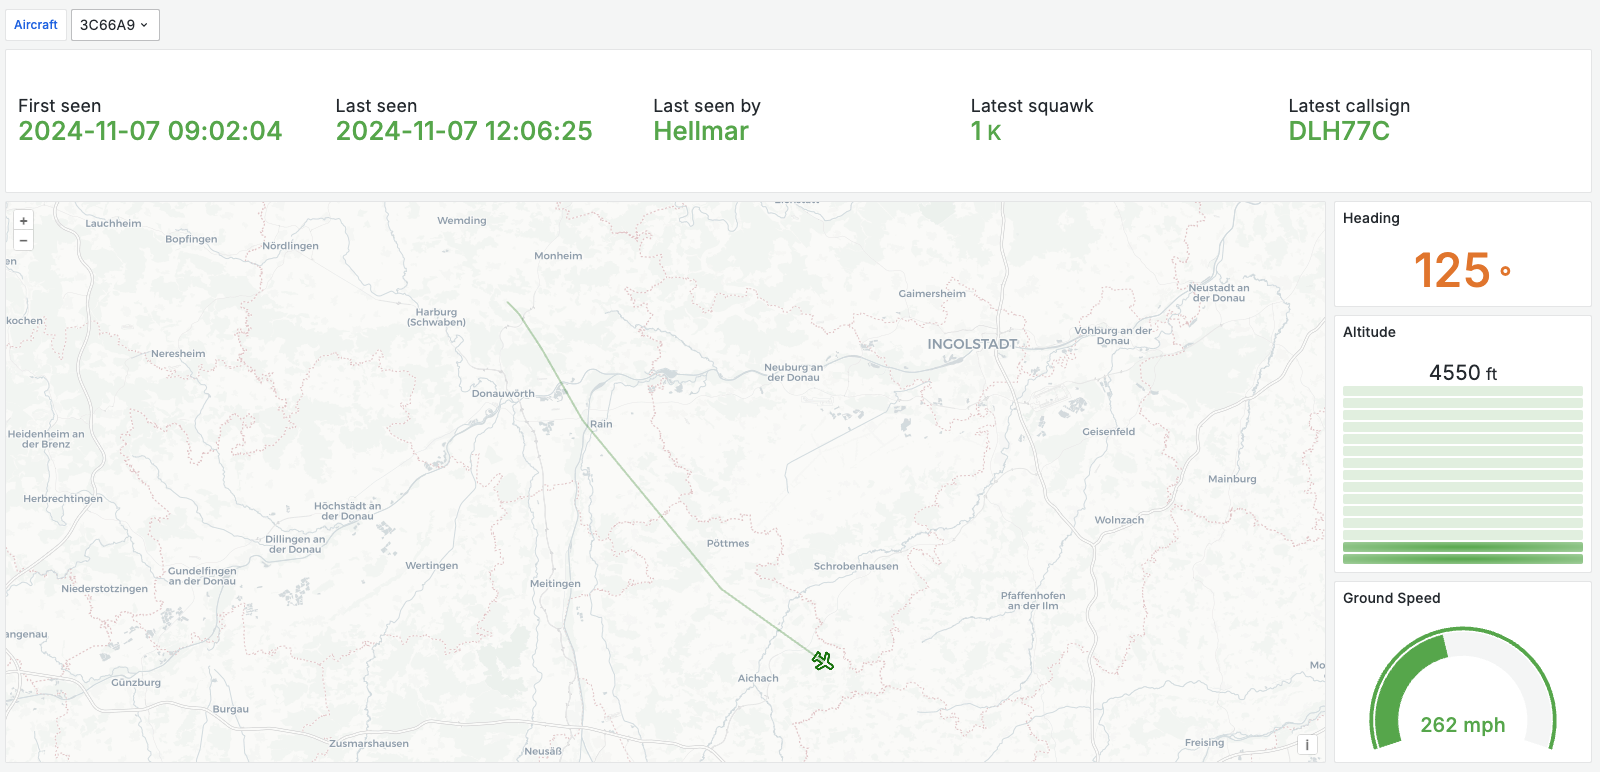
A Grafana dashboard showing the geo, track, altitude, and ground speed of an aircraft at a particular point in time, together with the route taken up to that point.
Identify more entity dimensions!
The data also includes some interesting other stuff:
client_id.client_latandclient_lon.
It turns out (because we built this system!!!) that these identify the people at Imply who are collecting the ADS-B data. It’s time to level up the model!
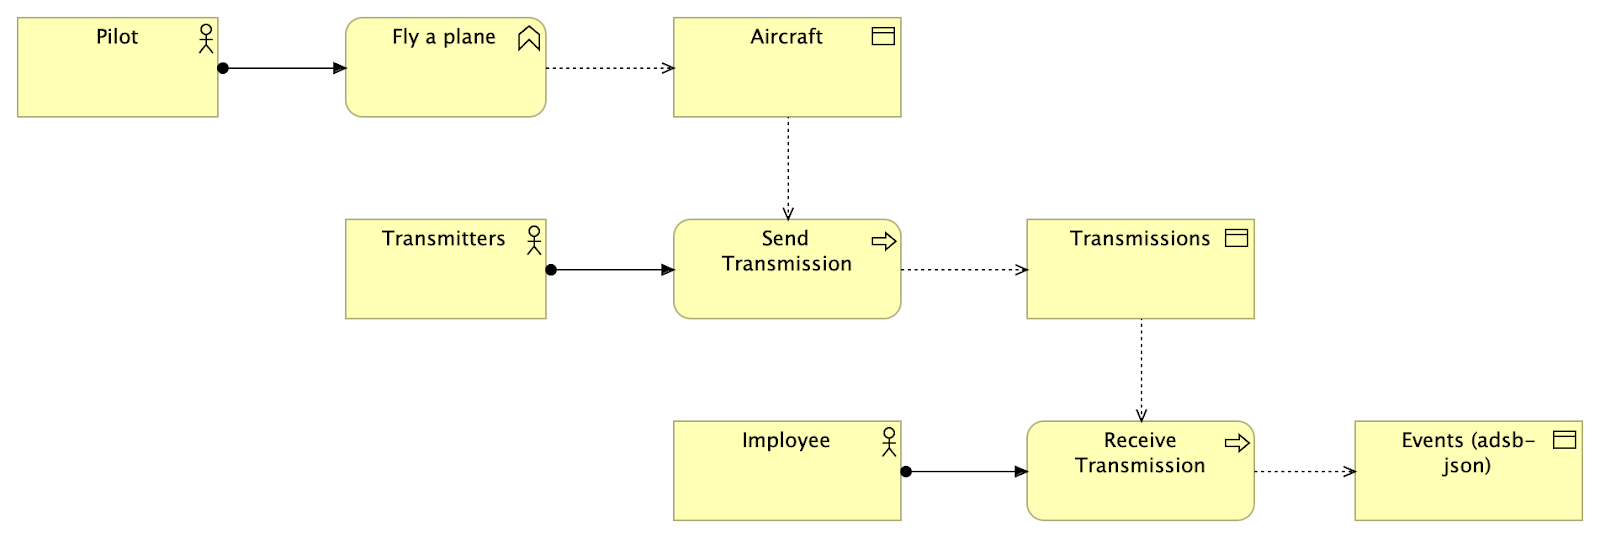
A pilot flies a plane and this affects an aircraft, transmitters send radio transmissions, and these are picked up by Imployees who receive transmissions and write them to a stream of events.
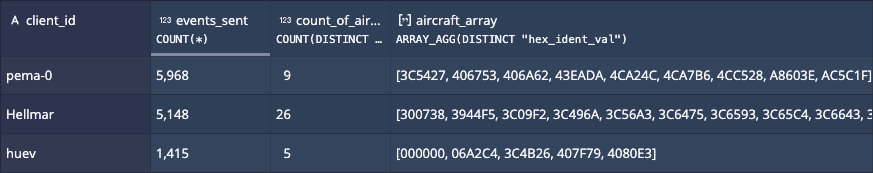
While the examples above are about reconstituting entities, this example leans into the other part of Eric’s challenge: aggregation of events. This query uses “Aircraft” entity data in combination with “Imployee” data to tell us what each receiver was seeing when “Receive Transmission” happened.
events_sentis a simple count of events emitted by the transmitter.count_of_aircraftis the number of distinct aircraft seen by the Imployee.aircraft_arrayreturns a list of the aircraft.
SELECT
  "client_id",
  COUNT(*) AS "events_sent",
  COUNT(DISTINCT "hex_ident_val") AS "count_of_aircraft",
  ARRAY_AGG(DISTINCT "hex_ident_val") AS "aircraft_array"
FROM "example-adsb-intro"
WHERE TIME_IN_INTERVAL("__time",'PT10M/2024-11-07T09:00')
GROUP BY 1
ORDER BY 2 DESC
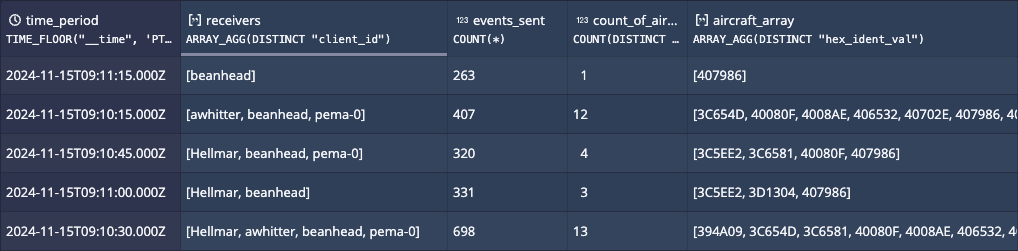
Notice that the TIME_IN_INTERVAL filter is letting us time-travel: we are looking at the view of the world that we recorded over a ten minute period in the past.
Thanks to event data being consumed in real-time, the following query goes right up to the latest data.
SELECT
  TIME_FLOOR("__time",'PT15S') AS "time_period",
  ARRAY_AGG(DISTINCT "client_id") AS "receivers",
  COUNT(*) AS "events_sent",
  COUNT(DISTINCT "hex_ident_val") AS "count_of_aircraft",
  ARRAY_AGG(DISTINCT "hex_ident_val") AS "aircraft_array"
FROM "example-adsb-intro"
WHERE "__time" > CURRENT_TIMESTAMP - INTERVAL 1 MINUTE
GROUP BY 1
ORDER BY 2 DESC
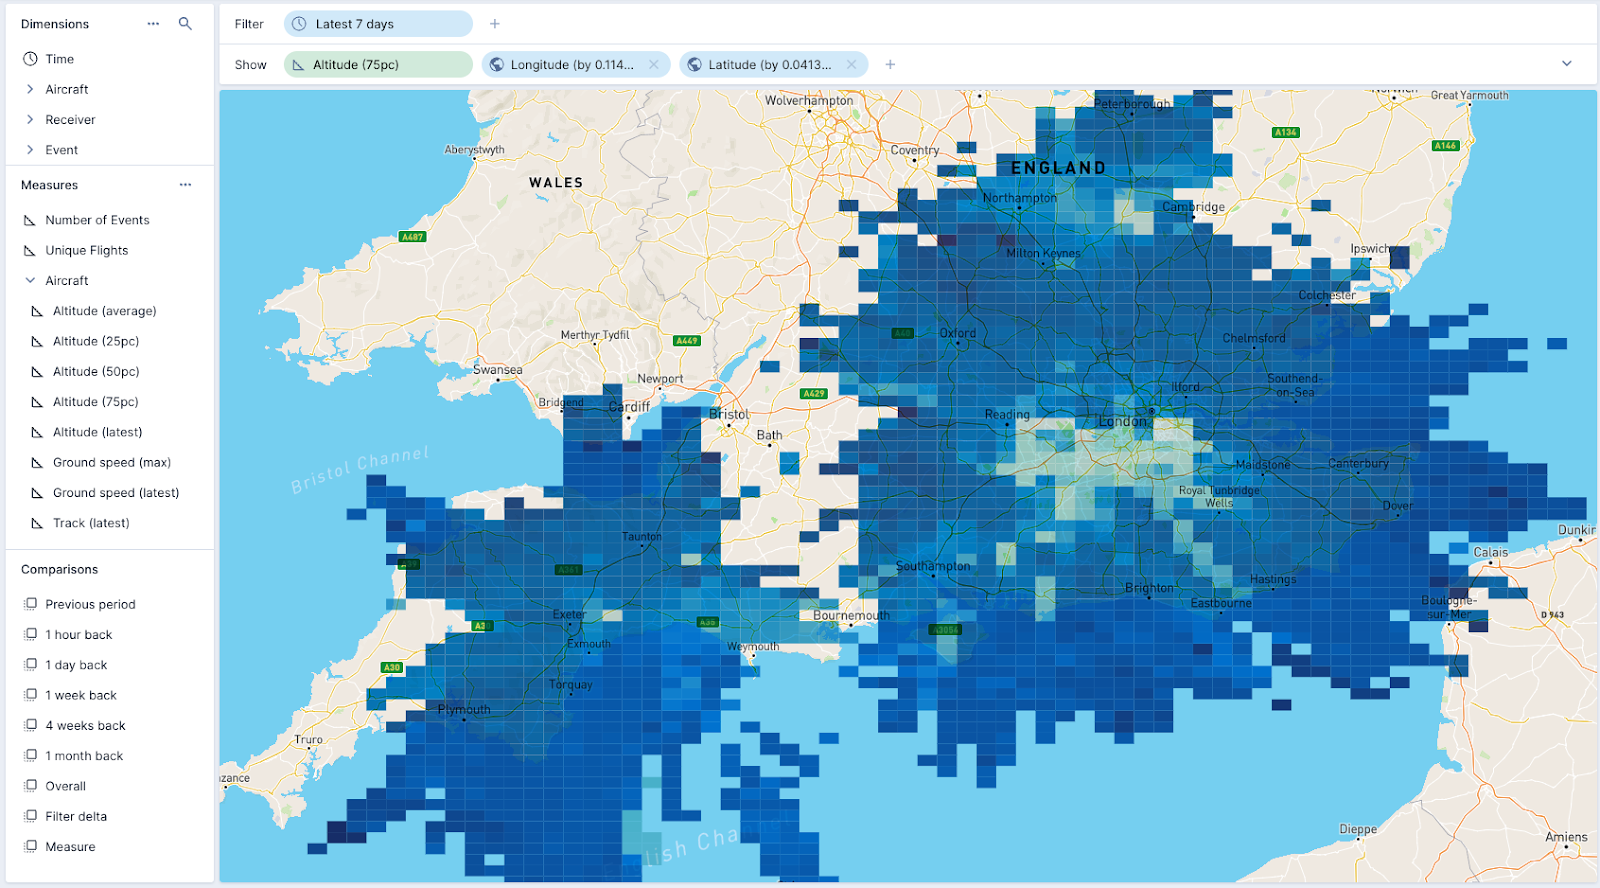
The team put the data into Imply Polaris, and created this sweet visualization of the 75th percentile altitude of aircraft over part of the United Kingdom. With more data about other entities, perhaps enriched with a lookup or a JOIN, this map would quickly become a way to explore the entire dataset, time-traveling along the event trail, and comparing stats in different time periods in real-time.
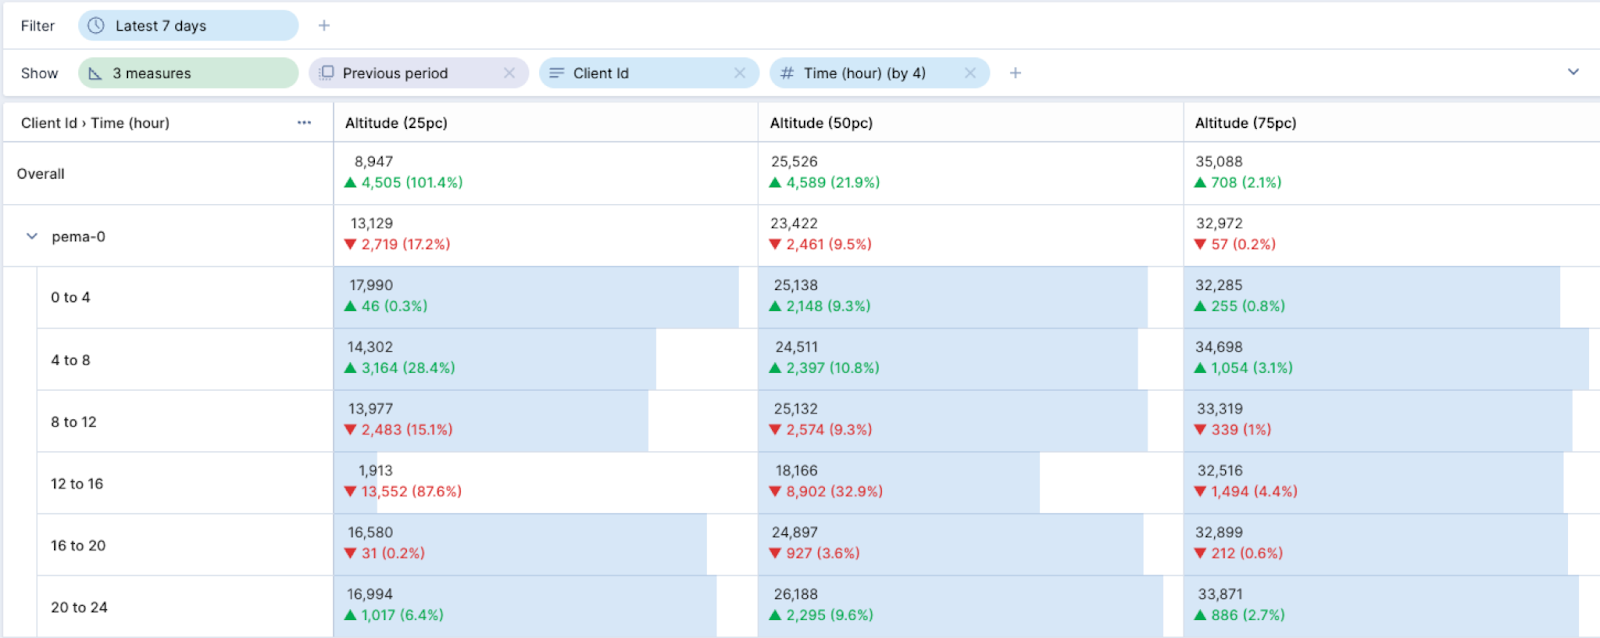
And this interesting table shows that, this week, most aircraft near my home seemed to be flying at a lower altitude than the week before… it must have been the rain!
A note on the future…
Using the interactive API - like has been done here - might not be the right API to use when it comes to reconstituting entity data. This type of entity instantiation takes any database some time to do when you need accuracy and completeness, and to get it you need to look at really long intervals of time.
The other API in Druid, the asynchronous MSQ API, is an option here, keeping your heavy operation away from interactive queries. And in Druid Summit 2024 we were all teased by two developments in Druid - Dart and projections - that promise to help speed these operations up.
And there are some other things that aren’t touched in this article, too!
Aggregating multiple streams into one table, giving one table from which multiple entities can be reconstructed, all from the same table.
Front-loading the GROUP BY operations (“rollup”) at ingestion time, reducing the granularity of incoming event streams. Here, a table might contain data at 5-minute intervals instead of every single event. (This is where projections will help…)
Filtering at ingestion time to discard events that do not contain data of interest. Here, there’s a specific list of transmission types that contain geospatial readings, for example.
Clustering data through sub-partitioning to optimize query execution. Here, perhaps the data could be partitioned by the different entity identifiers as these are what appear in WHERE and GROUP BY most commonly.
Conclusion
Even for the very narrow set of data used in this example, having a whiteboard description of the system being modelled helps to untangle event streams. Models like these help teams prioritise behaviour when understanding a system: entities (actors, objects) and events (actions). And, from there, to focus on building reports, dashboards, and visualisations that describe that behaviour.
In Druid, an event-based mindset has to be applied, and event data is all about behaviour. Something happened - a door was opened, an observation was taken - and you end up with data about the actor, the action, and the effect it had in the real world.
To summarise the approach:
Model the system: find the passive and active elements, and describe the behaviour.
Attach dimensions to each entity and behaviour.
Try to rebuild state and different statistics over time by using an appropriate aggregate function.
Hone the query to deal with sparsity and to enable time travel.
The Druid quickstart and example datasets make it easy for you to try this out for yourself. Use one of the example datasets in the Quickstart, apply the approach here: try to model the behaviour yourself, and experiment with different event-to-entity and event statistics queries.
You can also find learning resources on all the functions shown here in Imply’s repository of Python notebooks in implydata/learn-druid on Github.